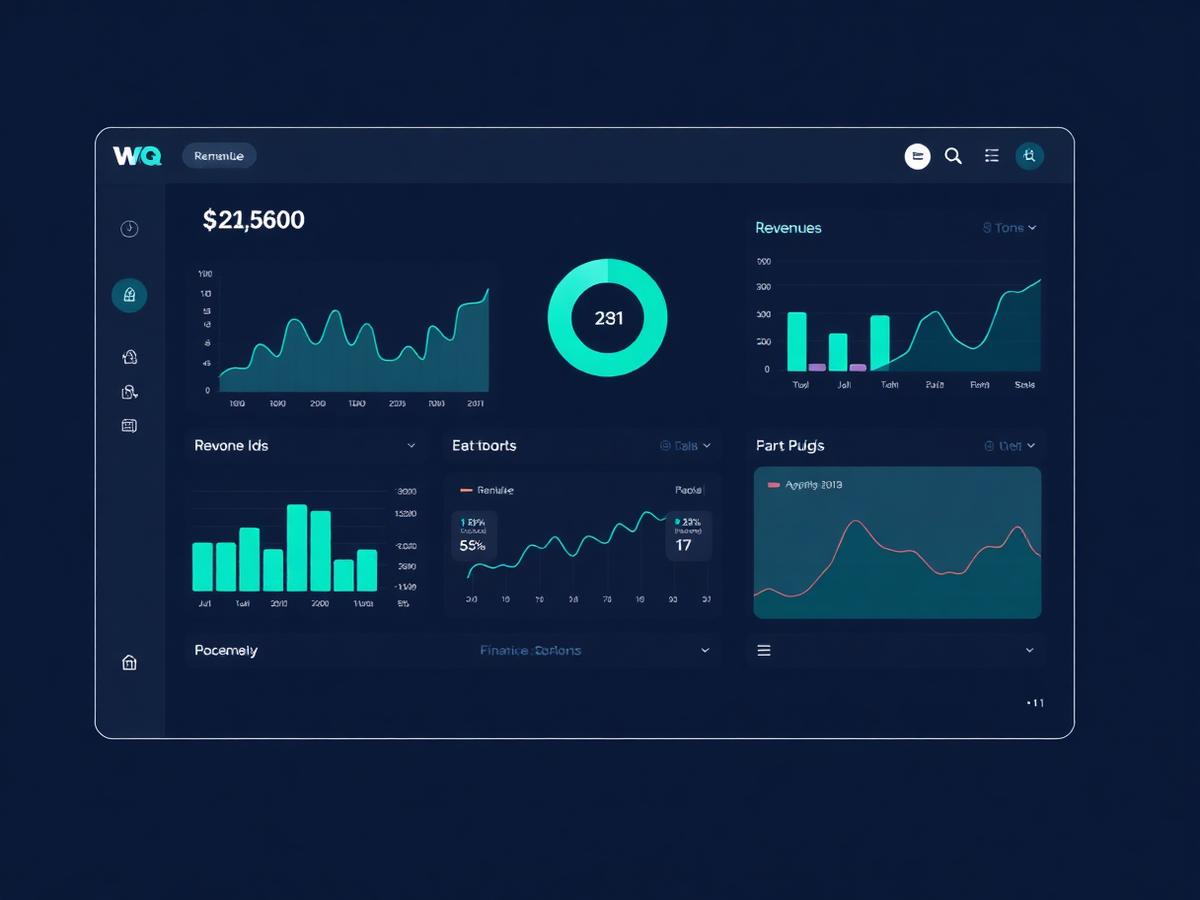
Finance Dashboard
Executive BIReal-time P&L, cash position and revenue split across business units.
Portfolio
A small sample of dashboards, reports and automations we've shipped — anonymized to protect client data.
Real-time P&L, cash position and revenue split across business units.
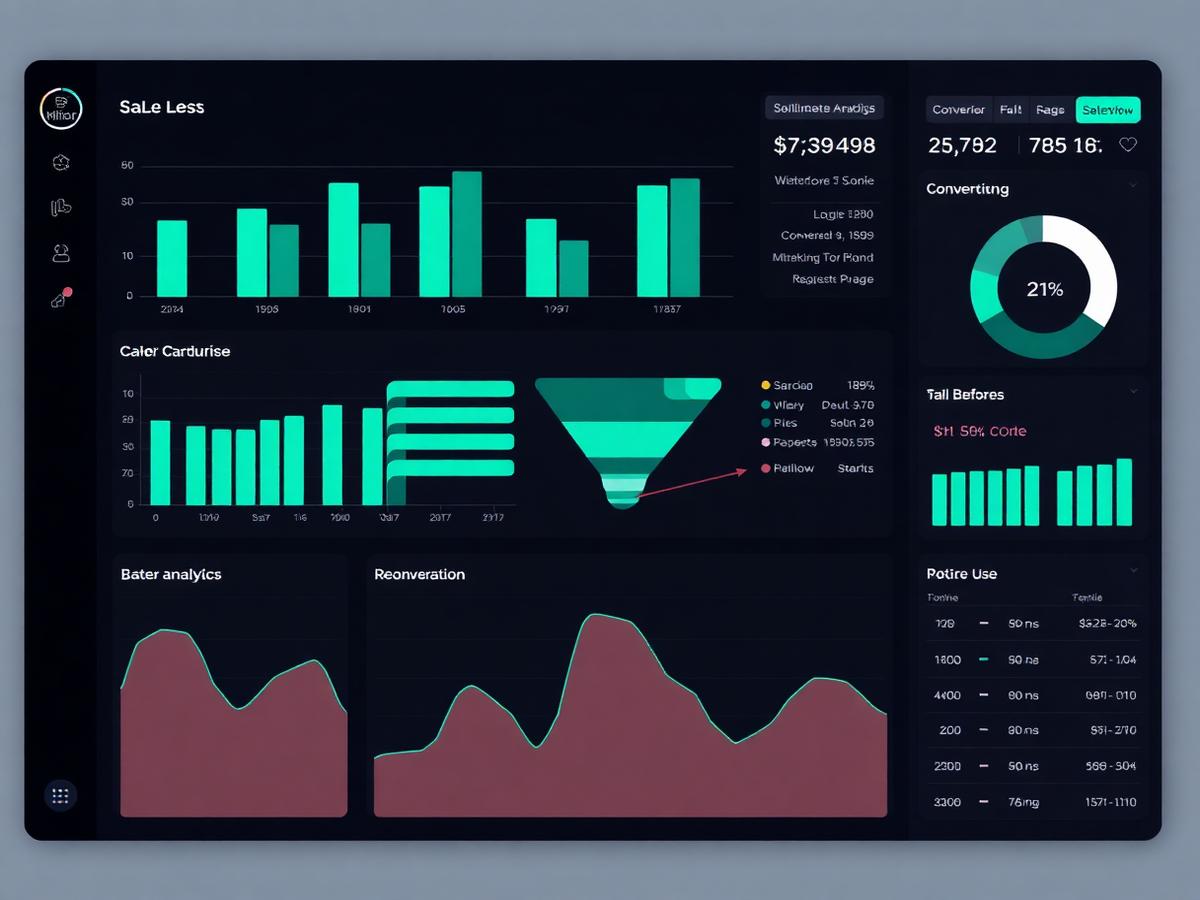
Pipeline funnel, conversion velocity and rep-level attribution.
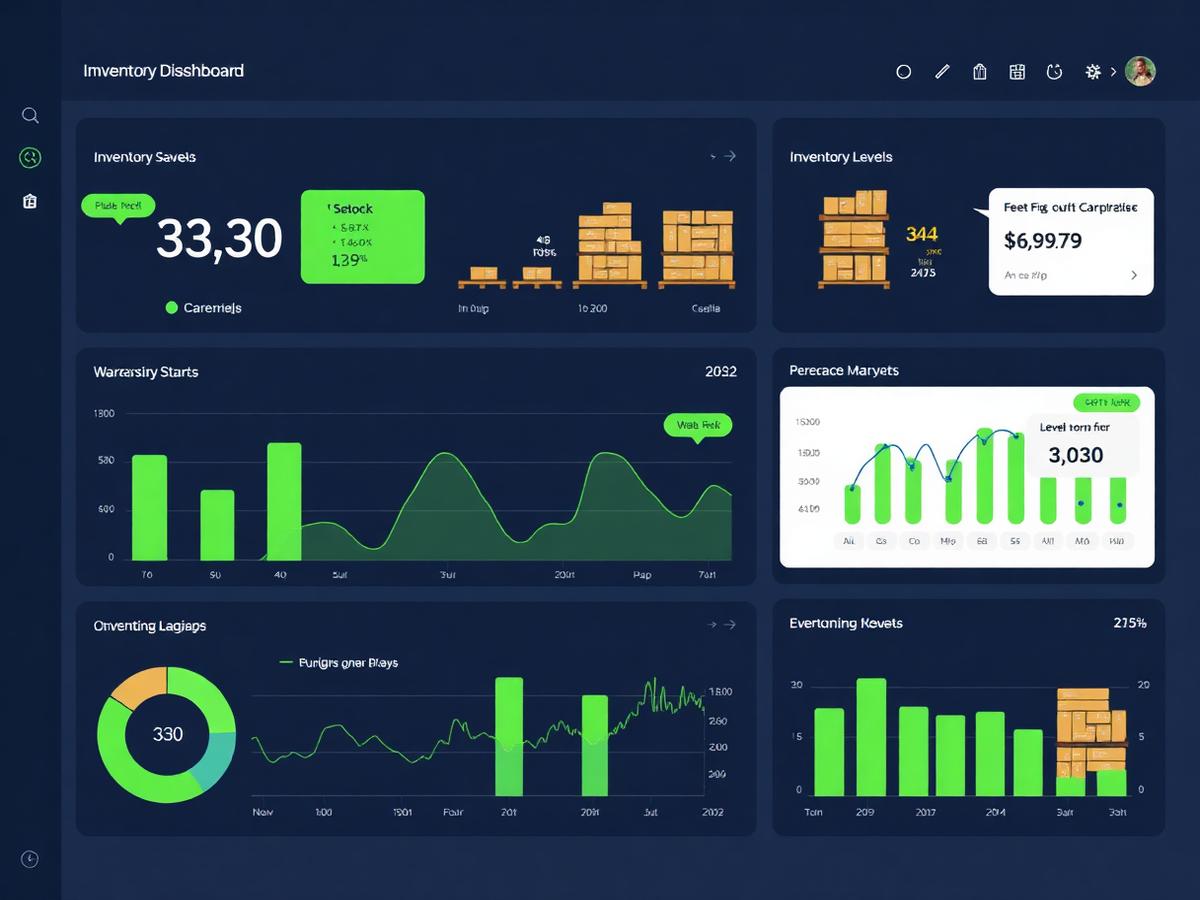
Stock levels, reorder forecasts and warehouse performance metrics.

Bulk PDF report generator processing 1,200+ daily statements.
Monthly financial pack with Power Query refresh and dynamic charts.
Collaborative sales tracker with live KPIs and team scorecards.
Board-ready summaries with narrative analytics and KPI commentary.
Automated ingestion from Shopify, Amazon and CSV drops.